


Photovoltaic will give the most competitive electricity
Photovoltaics has become cheaper by 20% every two years now for 38 years. Present electricity costs are 5 ¢/kWh in, e.g. Austin/ Texas (USA) or Abu Dhabi (United Arab Emirates) whereas electricity from the second cheapest, natural gas, is at 6 ¢/kWh, electricity from coal (new plants) at 8.5 ¢/kWh and nuclear electricity at 12-14 ¢/kWh. Based on published roadmaps from First Solar (www.FirstSolar.com) electricity costs will be at half the costs of 2014 after 2020. By then, electricity from photovoltaics will have an enormous competitive advantage.
However, solar electricity is highly intermittent from the rhythms of day and night, the seasons and clouds. It is possible with sophisticated combinations with energy storage and connections between time zones to make this electricity dispatchable ("firm", i.e. it always meets a prescribed load) at almost the same cost. We have developed several types of mathematics for the design of such networks and for the optimal combination of generation capacity and energy storage.
The next picture shows electricity costs for firm electricity after year 2020, based on published roadmaps on development of PV and batteries from major manufacturers.
Clearly, these costs are so much lower than costs from any competitive way of generating electricity that a very fast continued growth of PV will happen.
This is in particular true as PV is very robust and reliable so that some of the biggest finance institutions give money at very low costs of about 5 percent/year including depreciation for new installations of PV. So far this is true only for countries where these installations are safe, i.e. most of the slightly more developed countries but the trend is obvious, financing of PV installations will help to have continued high growth rates of PV.


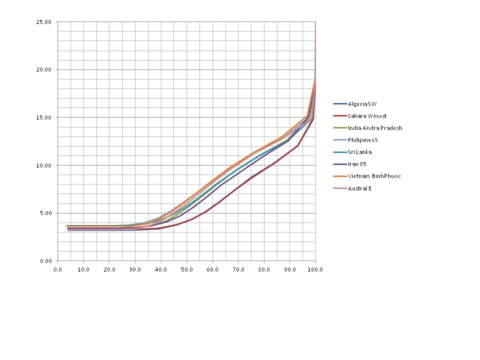
Levelized costs of electricity for PV shows only half the truth
The picture above shows that costs for electricity increase very rapidly if coverage during most of the daytime is desired. As globally, on average, nights take 50 percent of the time it is not possible to cover demand for longer than half the 24 hours of a day, on average. Of course, in summer coverage is longer than 12 hours, for example 16 hours in June in Hamburg, but in winter coverage is correspondingly shorter.
Also, this picture is somewhat misleading as even the 50 percent coverage is only possible with some minimal amount of storage. This becomes apparent from the next picture.
The art of meeting the load
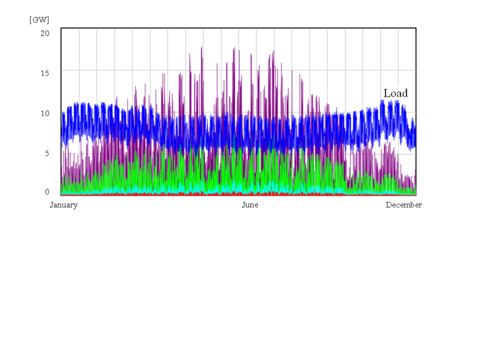
In Europe, load and insolation have a poor match
The picture above shows the load pattern over one year for a European country, here Austria. The pattern is very similar for the EU27 taken together, higher demand in winter than in summer and lower demand during the night than during the day (blue lines - data are from ENTSO E). In comparison, insolation is higher in summer than in winter by a factor of about 7 to 1 to 5 to 1 in most parts of Europe, the purple lines show insolation in a southern European country, the green line shows insolation in a northern European country. In summer, the generation will on some days very soon surpass the demand whereas in winter demand is much higher than the generation. Moreover, generation fluctuates considerably due to cloud cover and the pattern of day and night (data are from NASA Solar Sizer for a grid of 1° x 1°).
This picture shows that some minimal amount of storage is necessary so that demand can be met with generated electricity even on days with high insolation.
Storage improves the coverage considerably
Adding storage without planning
The preceeding picture shows how use of storage has two effects: its increases the period of coverage of the load up to about 100 percent and it increases the costs of electricity considerably from between 3 ¢ /kWh - 4 ¢ /kWh to up to 15 ¢/kWh to 20 ¢/kWh.
Here, the storage is added by many individual actors, whether it is companies, households or power stations. In other words, there is no optimization of the ratio of generation capacity and storage.
However, our group found a nice relationship between a load that has to be met and the necessary generation capacity and storage. Naturally, if generation capacity is increased, the sunlight can cover the load earlier in the morning and longer in the afternoon so that less storage is necessary. On the other hand, if the amount of storage is increased, the amount of generation capacity necessary to meet the load can be decreased. This is shown by the next picture.
G-S Isoline between generation capacity and storage
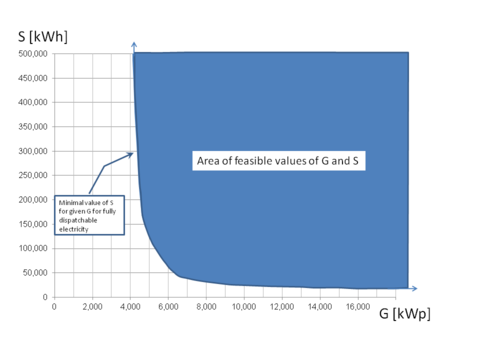
A nice smooth relationship between necessary generation capacity and storage
The preceding graphics shows that a minimum amount of generation capacity is necessary to meet a given load, here 1 MW. In the extreme, the low value of about 4200 kWp of generation capacity can give a sufficient amount of electricity so that the load can always be met, although with a very high amount of storage of 500,000 kWh, i.e. sufficient to meet the load for almost three weeks (21 days with 24 hours each with a load of 1000 kW gives 504,000 kWh of electricity consumption during three weeks.
Increasing the generation capacity just a little bit allows to meet the load with a much lower amount of storage. However, the rhythms of day and night and some effects of clouds need storage, so that a minimum amount of about 25,000 kWh of storage is always necessary even if a very high amount of generation capacity is used.
If higher amounts of both are used, storage and generation capacity, then the load can be met as well; this is the solid area in the upper right of the curve. The curve, the outer boundary of this solid area, is the minimum of generation capacity and storage that is necessary to meet the load.
Such G-S Isolines are very suitable for optimizing the amount of generation capacity and storage to achieve supply of dispatchable electricity at minimal costs.
The graph above with electricity costs for a variety of networks (Stmk, i.e. Styria, and the last one G36, a global network of 36 or 60 locations) was calculated using G-S Isolines.
The calculation is done over 20 years with daily data from NASA Solar Sizer available in a global grid of 1° x 1°. The disadvantage of these data is that the temporal resolution is only 1 day, the advantage is that these data are available over a long period of time (1984 to 2005), and for the whole globe so that this is a coherent data set for global planning.
See our publication for more details.
Wolf D.Grossmann, Iris Grossmann, Karl W.Steininger. 2012.
Distributed solar electricity generation across large geographic areas,
Part I:A method to optimize site selection,generation and storage
Renewable and Sustainable Energy Reviews.
Exponential technologies
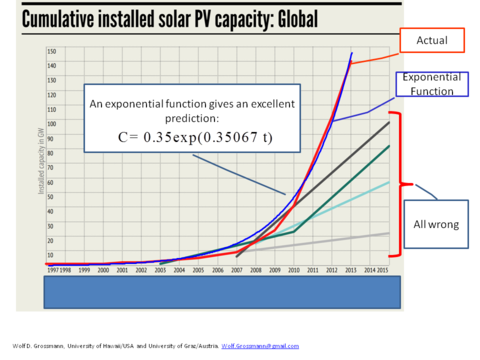
Exponential technologies for large-scale problem solving
The preceding graph uses material from Meister Consultance Group 2015, http://www.mc-group.com/wp-content/uploads/2015/03/MCG-Renewable-Energy-Revolution-Infographic.pdf. This group has analyzed the predictions on PV capacity growth from Greenpeace and the International Energy Agency in Paris. These two groups have consistently underestimated the growth of globally installed PV capacity. The have repeatedly used a linear projection, they may have used a ruler for their next prediction. The actual development, however, went ever faster. We here use a simple exponential function (C = 0.35 exp(0.35067 x Year)) for the prediction of globally installed PV capacity, and this exponential function does a much better job than the forecasts with a ruler.
This example should serve in two ways:
Never underestimate technologies that develop exponentially, as was here done by two renowned groups
Become aware that exponential technologies may be phantastic to solve problems.
At present, PV is becoming highly useful in much of the developing world and its impact is visible in places with wealth and high electricity costs such as Hawaii, which is that part of the U.S. that has the highest electricity costs of about 35 ¢/kWh because electricity is generated in Hawaii from imported petroleum with generators.
Above we have given a reasoning why this fast growth of PV will most likely continue for several more years. So far, globally installed capacity of PV has grown from 1976 to 2014 by a factor of 500,000. It now is at 200 gigawatt (GW) which is less than 2 percent of the global electricity consumption. If PV would continue its pattern of doubling installed capacity every two years we would, by the numbers, have a completely solar electricity supply within 12 years, i.e. in 2027. There are few reasons why the pattern of growth should slow down, but many reasons why it can stay at the long-term pattern. We do not yet know. The necessary investments are very high, but the costs of running the present electricity sector are even higher, just for the costs of coal and natural gas, to say nothing of petroleum, which is still widely used and nuclear fuel. Moreover, the costs of operation and maintenance of PV are very low, about 1% per year, whereas costs for O&M of power plants with fuel are much higher. And so on. It is fascinating; we here have an exponential technology (PV) competing with a group of other technologies (turbines, generators, wind power plants, ) and none of the latter is exponential. Accordingly, for example, CSP lost in 2012 against PV. CSP, concentrated solar power, uses the heat of the sun to convert water into steam which is then driving turbines which in turn drive generators. It was utterly foreseeable that PV - a semiconductor technology - would become cheaper than CSP within a predictable time span. In 2013, PV became cheaper than wind power in almost all locations. Here, the relationship is much more complex as wind is often strongest when sunshine is low - in winter - or not available - at night.
However, now the issue is becoming fascinating:
PV is not the only exponential technology in the present set of new energy technologies.
Lithium-ion batteries are also an exponential technology. Here, costs decrease per year by 7 percent. Li-ion are exponential because nanotechnology helps to put more electrons into the same volume and nanotech is exponential. PV is exponential for the same reason: nanotech is getting ever better at capturing photons, i.e improve the efficiency of PV.
The third important technology here is also exponential, it is the often forgotten power electronics which is now semiconductor-based. Without power electronics PV would be useless; without power electronics high-voltage DC transmission would be much more expensive.
The fourth important technology is software, which obviously is also exponential because the availability of more software supports creation of more software (with better editors, compilers and so on the programmers can do a better job- knowledge is growing exponentially).
And the fifth and final technology may most likely also become exponential. DC can for example also be led through aluminum tubes instead of copper wires so that nanopolishing the tubes would allow to make isolation of the tubes much more efficient and thus cheaper. We do not yet know, but DC has many advantages over AC which lend themselves to better us of exponential technologies also for transmission.
Together these five technologies will much more rapidly change our present energy system than is expected by most decision makers.
The mathematical methods which are demonstrated here will help to make a breakthrough. For example, Elon Musk said, when announcing the new batteries for power applications from Tesla, that 2 billion of these would allow a global solar energy supply. By that time we had done such calculations, see the article mentioned above. Musk is correct, 2 billion Powerwalls is 14 Terawatt hours of storage. Electricity costs would be 3 ¢/kWh for dispatchable electricity, which is good. However, as shown above, costs of 2.1 ¢ /kWh are possible with optimized selection of locations and optimal choice of generation capacity and storage.
In summary, the new energy system may be much closer than most analysts expect.